Categories: Featured Articles » Practical Electronics
Number of views: 124786
Comments on the article: 1
Taking an Oscilloscope Measurement
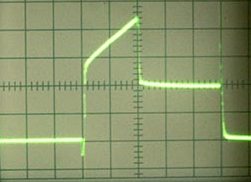 A digital oscilloscope is, of course, much more perfect than a conventional electronic one, it allows you to remember waveforms, can connect to a personal computer, has mathematical processing of results, screen markers and much more. But with all the advantages, these new generation devices have one significant drawback - this is a high price.
It is she who makes the digital oscilloscope inaccessible for amateur purposes, although there are “pocket” oscilloscopes worth only a few thousand rubles, which are sold on Aliexpress, but it is not particularly convenient to use them. Well, just an interesting toy. Therefore, while we will talk about measurements using an electronic oscilloscope.
On the topic of choosing an oscilloscope for use in a home laboratory on the Internet, you can find a sufficient number of forums. Without denying the advantages of digital oscilloscopes, it is advised in many forums to opt for simple, small-sized and reliable domestic oscilloscopes C1-73 and C1-101 and the like, which we previously met in this article.
At a fairly affordable price, these devices will allow you to perform most amateur radio tasks. In the meantime, let's get acquainted with the general principles of measurements using an oscilloscope.
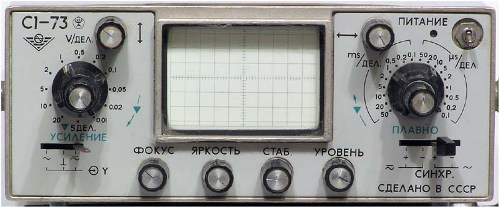
Figure 1. Oscilloscope S1-73
What an oscilloscope measures
The measured signal is fed to the input of the vertical deflection channel Y, which has a large input resistance, usually 1MΩ, and a small input capacitance, not more than 40pF, which allows introducing minimal distortion into the measured signal. These parameters are often indicated next to the input of the vertical deflection channel.
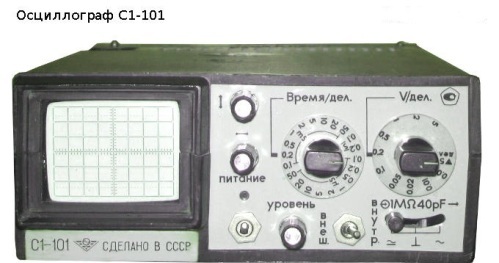
Figure 2. Oscilloscope C1-101
High input impedance is typical of voltmeters, so it is safe to say that the oscilloscope measures voltage. The use of external input dividers allows you to reduce the input capacitance and increase the input impedance. It also reduces the influence of the oscilloscope on the signal under investigation.
It should be remembered that there are special high-frequency oscilloscopes, the input impedance of which is only 50 Ohms. In amateur radio practice, such devices do not find application. Therefore, further we will focus on conventional universal oscilloscopes.
Channel Y bandwidth
The oscilloscope measures voltages in a very wide range: from DC voltages to voltages of a sufficiently high frequency. The voltage swing can be quite diverse, from tens of millivolts to tens of volts, and when using external dividers up to several hundred volts.
It should be borne in mind that the bandwidth of the channel of the vertical deviation Y db not less than 5 times higher than the frequency of the signal to be measured. That is, the amplifier of the vertical deviation must pass at least the fifth harmonic of the signal under study. This is especially required when studying rectangular pulses that contain many harmonics, as shown in Figure 3. Only in this case, an image with minimal distortion is obtained on the screen.
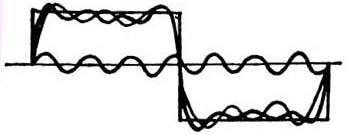
Figure 3. Synthesis of a rectangular signal from harmonic components
In addition to the fundamental frequency, Figure 3 shows the third and seventh harmonics. As the harmonic number increases, its frequency increases: the frequency of the third harmonic is three times higher than the fundamental, the fifth harmonic is five times, the seventh is seven, etc. Accordingly, the amplitude of the higher harmonics decreases: the higher the harmonic number, the lower its amplitude. Only if the amplifier of the vertical channel without much attenuation can miss the higher harmonics, the image of the pulse will be rectangular.
Figure 4 shows the waveform of a meander with insufficient channel Y bandwidth.
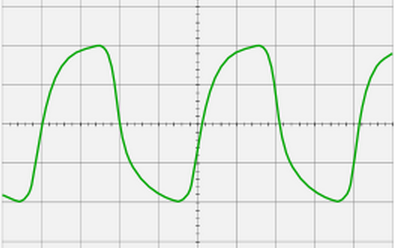
Figure 4
The meander with a frequency of 500 KHz looks something like this on the screen of an OMSh-3M oscilloscope with a bandwidth of 0 ... 25 KHz. As if rectangular pulses were passed through an integrating RC circuit. Such an oscilloscope was produced by Soviet industry for laboratory work in physics lessons in schools. Even the supply voltage of this device for safety reasons was not 220, but only 42V. It is absolutely obvious that an oscilloscope with such a bandwidth will make it possible to observe a signal with frequencies of no more than 5 kHz with almost no distortion.
For a conventional universal oscilloscope, the bandwidth is most often 5 MHz. Even with such a band, you can see a signal up to 10 MHz and higher, but the image received on the screen allows you to judge only the presence or absence of this signal. It will be difficult to say anything about its shape, but in some situations the shape is not so important: for example, there is a sinusoid generator, and it is enough to make sure that there is this sinusoid or not. Just such a situation is shown in Figure 4.
Modern computing systems and communication lines operate at very high frequencies, on the order of hundreds of megahertz. To see such high-frequency signals, the bandwidth of the oscilloscope must be at least 500 MHz. Such a wide band really “expands” the price of the oscilloscope.
An example is the digital oscilloscope U1610A shown not in Figure 5. Its bandwidth is 100 MHz, and the price is almost 200,000 rubles. Agree, not everyone can afford to buy such an expensive device.
Figure 5
Let the reader not consider this picture as an advertisement, since all the coordinates of the seller are not painted over: any similar screenshot could appear in the place of this picture.
Types of studied signals and their parameters
The most common type of oscillation in nature and technology is a sinusoid. This is the same long-suffering function Y = sinX, which was held at the school in the lessons of trigonometry. Quite a lot of electrical and mechanical processes have a sinusoidal shape, although quite often other forms of signals are used in electronic technology. Some of them are shown in Figure 6.
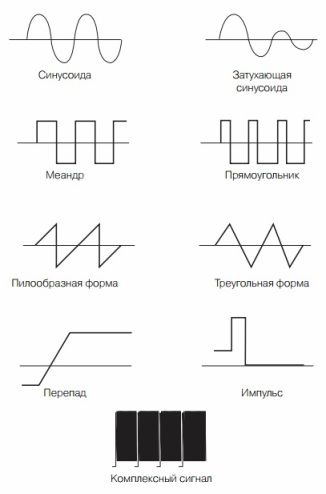
Figure 6. Forms of electrical vibrations
Periodic signals. Signal Characteristics
A universal electronic oscilloscope allows you to accurately study periodic signals. If, on input Y, you send a real sound signal, for example, a musical phonogram, then randomly flickering bursts will be visible on the screen. Naturally, it is impossible to investigate such a signal in detail. In this case, the use of a digital storage oscilloscope will help, which allows you to save the waveform.
The oscillations shown in Figure 6 are periodic, repeated after a certain period of time T. This can be considered in more detail in Figure 7.
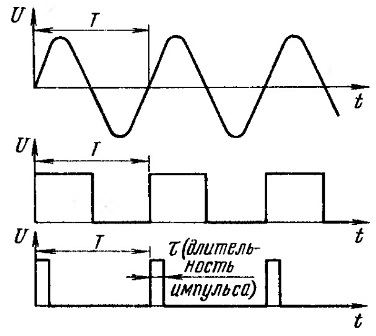
Figure 7. Periodic fluctuations
The oscillations are depicted in a two-dimensional coordinate system: stress is measured along the ordinate axis, and time is measured along the abscissa axis. Voltage is measured in volts, time in seconds. For electrical vibrations, time is often measured in milliseconds or microseconds.
In addition to components X and Y, the waveform also contains component Z - intensity, or simply brightness (figure 8). It is she who turns on the beam for the time of the forward beam and extinguishes for the time of the return stroke. Some oscilloscopes have an input for controlling the brightness, which is called input Z. If you apply a pulse voltage from a reference generator to this input, you can see the frequency labels on the screen. This allows you to more accurately measure the duration of the signal along the X axis.
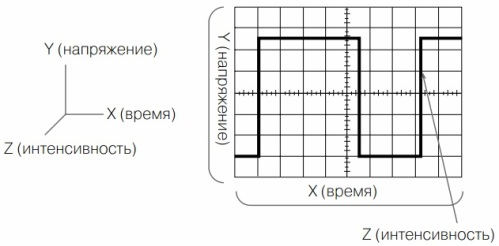
Figure 8. Three components of the investigated signal
Modern oscilloscopes have, as a rule, time-calibrated sweeps that allow accurate timing. Therefore, using an external generator to create tags is practically not necessary.
At the top of Figure 7 is a sine wave. It is easy to see that it begins at the beginning of the coordinate system. During time T (period), one complete oscillation is performed. Then everything repeats, the next period. Such signals are called periodic.
Rectangular signals are shown below the sine wave: meander and rectangular pulse. They are also periodic with period T. The pulse duration is denoted as τ (tau). In the case of a meander, the pulse duration τ is equal to the pause duration between pulses, just half the period T. Therefore, the meander is a special case of a square wave.
Duty and Duty Rate
To characterize rectangular pulses, a parameter called duty cycle is used. This is the ratio of the pulse repetition period T to the pulse duration τ. For the meander, the duty cycle is equal to two, - the value is dimensionless: S = T / τ.
In English terminology, just the opposite is true. There, the pulses are characterized by the duty cycle, the ratio of the pulse duration to the period of the Duty cycle: D = τ / T. The fill factor is expressed in %%. Thus, for the meander, D = 50%. It turns out that D = 1 / S, duty cycle and duty cycle are mutually inverse, although they characterize the same pulse parameter. The waveform of the meander is shown in Figure 9.
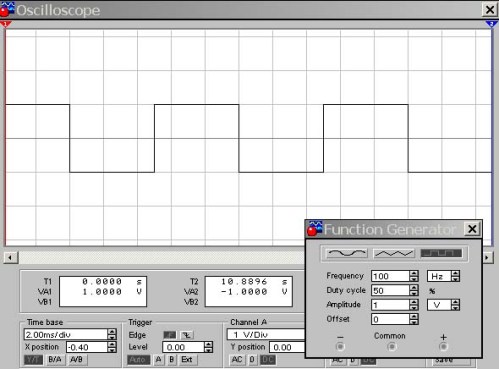
Figure 9. Waveform of the meander D = 50%
Here, the input of the oscilloscope is connected to the output of the functional generator, which is shown immediately in the lower corner of the figure. And here an attentive reader may ask a question: “The amplitude of the output signal from the 1V generator, the sensitivity of the oscilloscope input is 1V / div., And the screen displays rectangular pulses with a magnitude of 2V. Why?"
The fact is that the functional generator generates bipolar rectangular pulses with respect to the 0V level, approximately the same as a sine wave, with positive and negative amplitudes. Therefore, pulses with a span of ± 1V are observed on the oscilloscope screen. In the following figure, we change the duty cycle, for example, to 10%.
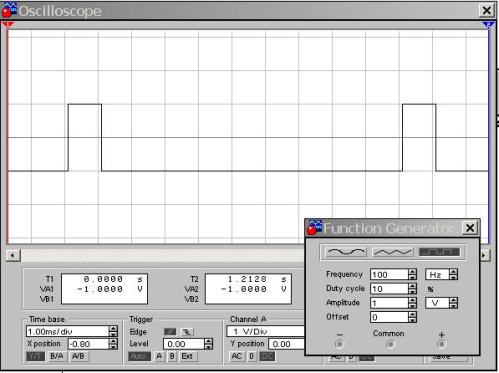
Figure 10. Rectangular momentum D = 10%
It is easy to see that the pulse repetition period is 10 cells, while the pulse duration is only one cell. Therefore, D = 1/10 = 0.1 or 10%, as can be seen from the settings of the generator. If you use the formula for calculating the duty cycle, you get S = T / τ = 10/1 = 1 - the value is dimensionless. Here we can conclude that the duty cycle characterizes the impulse much more clearly than the duty cycle.
Actually, the signal itself remained the same as in Figure 9: a rectangular pulse with an amplitude of 1 V and a frequency of 100 Hz. Only the fill factor or duty cycle is changing, it’s like someone is more familiar and convenient. But for the convenience of observation in Figure 10, the scan duration is halved compared to Figure 9 and is 1ms / div. Therefore, the signal period takes 10 cells on the screen, which makes it fairly easy to verify that the duty cycle is 10%. When using a real oscilloscope, the sweep duration is selected approximately the same.
Rectangular pulse voltage measurement
As mentioned at the beginning of the article, the oscilloscope measures voltage, i.e. potential difference between two points. Typically, measurements are taken relative to a common wire, ground (zero volts), although this is not necessary. In principle, it is possible to measure from minimum to maximum signal values (peak value, peak-to-peak). In any case, the measurement steps are quite simple.
Rectangular pulses are most often unipolar, which is typical for digital technology. How to measure the voltage of a rectangular pulse is shown in Figure 11.
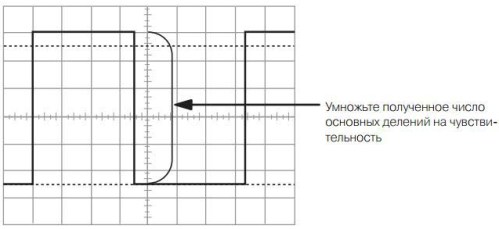
Figure 11. Measurement of the amplitude of a rectangular pulse
If the sensitivity of the vertical deviation channel is 1V / div, then it turns out that the figure shows a pulse with a voltage of 5.5V. With a sensitivity of 0.1V / div. The voltage will be only 0.5V, although on the screen both pulses look exactly the same.
What else can be seen in a rectangular impulse
The rectangular pulses shown in Figures 9, 10 are simply ideal because they are synthesized by Electronics WorkBench. And the pulse frequency is only 100 Hz, therefore, problems with the "squareness" of the image can not arise. In a real device, at a high repetition rate, the pulses are somewhat distorted, first of all, various surges and bursts appear due to the installation inductance, as shown in Figure 12.
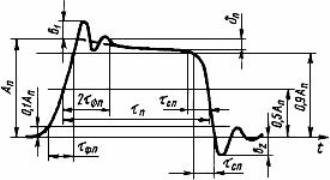
Figure 12. Real Rectangular Impulse
If you do not pay attention to such "trifles", then the rectangular impulse looks like that shown in Figure 13.
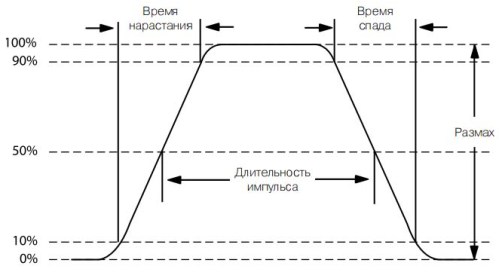
Figure 13. Parameters of a rectangular pulse
The figure shows that the leading and trailing edges of the pulse do not appear immediately, but have some rise and fall times, and are somewhat inclined relative to the vertical line. This slope is due to the frequency properties of microcircuits and transistors: the higher the frequency transistor, the less “fronts” of the pulses. Therefore, the pulse duration is determined by the level of 50% of the full range.
For the same reason, the amplitude of the pulse is determined by the level of 10 ... 90%. The pulse duration, as well as the voltage, is determined by multiplying the number of divisions of the horizontal scale by the division value, as shown in Figure 14.
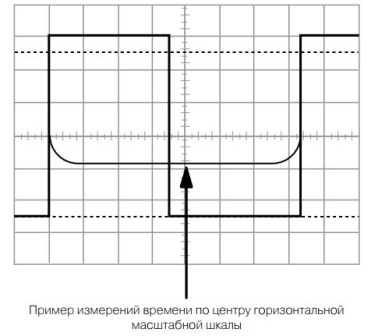
Figure 14.
The figure shows one period of a rectangular pulse, slightly different from the meander: the duration of a positive pulse is 3.5 divisions of the horizontal scale, and the pause duration is 3.8 divisions. The pulse repetition period is 7.3 divisions. Such a picture may belong to several different pulses with different frequencies. Everything will depend on the duration of the sweep.
Assume a scan duration of 1ms / div. Then the pulse repetition period is 7.3 * 1 = 7.3ms, which corresponds to the frequency F = 1 / T = 1 / 7.3 = 0.1428KHz or 143 Hz. If the scan duration is 1 µs / div, then the frequency will turn out to be a thousand times higher, namely 143KHZ.
Using the data in Figure 14, it is not difficult to calculate the duty cycle of the pulse: S = T / τ = 7.3 / 3.5 = 2.0857, it turns out almost like a meander. Duty cycle duty cycle D = τ / T = 3.5 / 7.3 = 0.479 or 47.9%. It should be noted that these parameters are in no way dependent on the frequency: duty cycle and duty cycle were calculated simply by divisions on the waveform.
With rectangular impulses, everything seems to be clear and simple. But we completely forgot about the sine wave. In fact, the same thing is there: you can measure voltages and time parameters. One sine wave period is shown in Figure 15.
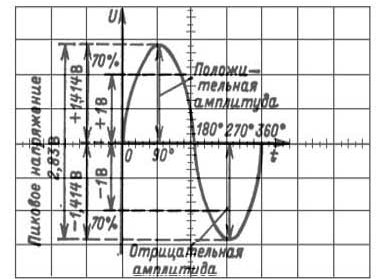
Figure 15. Sine Wave Parameters
Obviously, for the sinusoid shown in the figure, the sensitivity of the vertical deflection channel is 0.5 V / div. The remaining parameters can be easily determined by multiplying the number of divisions by 0.5V / div.
The sine wave may be another, which will have to be measured with sensitivity, for example, 5V / div. Then instead of 1V you get 10V. However, on the screen, the image of both sinusoids looks exactly the same.
The timing of the shown sinusoid is unknown. If we assume that the scan duration is 5ms / div, the period will be 20ms, which corresponds to a frequency of 50Hz. The numbers in degrees on the time axis indicate the phase of the sinusoid, although this is not particularly important for a single sinusoid. More often it is necessary to determine the phase shift (directly in milliseconds or microseconds) at least between two signals. This is best done with a two-beam oscilloscope. How this is done will be shown below.
How to measure current with an oscilloscope
In some cases, measurement of the magnitude and shape of the current is required. For example, alternating current flowing through a capacitor is ahead of voltage by ¼ period. Then, a resistor with a small resistance (tenths of an Ohm) is included in the open circuit. Such resistance does not affect the operation of the circuit. The voltage drop across this resistor will show the shape and magnitude of the current flowing through the capacitor.
A similar gauge ammeter is arranged in approximately the same way, which will be included in the breaking of the electric circuit. In this case, the measuring resistor is located inside the ammeter itself.
The circuit for measuring the current through the capacitor is shown in Figure 16.
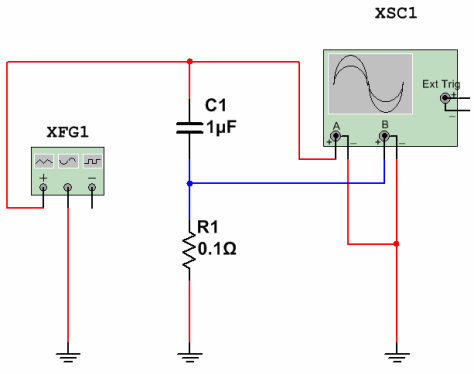
Figure 16. Current measurement through a capacitor
A sinusoidal voltage of 50 Hz with an amplitude of 220 V from the XFG1 generator (red beam on the oscilloscope screen) is supplied to the serial circuit from the capacitor C1 and the measuring resistor R1. The voltage drop across this resistor will show the shape, phase and magnitude of the current through the capacitor (blue beam). How it will look on the oscilloscope screen is shown in Figure 17.
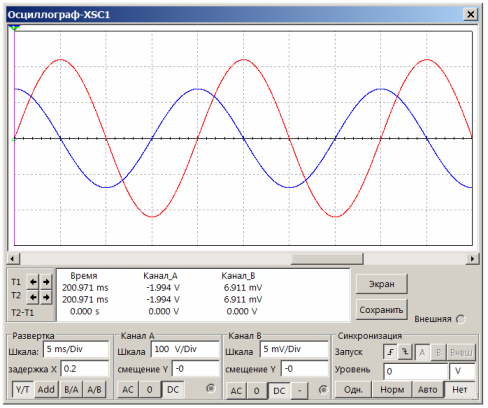
Figure 17. The current through the capacitor is ahead of the voltage by ¼ period
At a sine wave frequency of 50 Hz and a scan time of 5 ms / Div, one sine wave period takes 4 divisions along the X axis, which is very convenient for observation. It is easy to see that the blue ray is ahead of the red by exactly 1 division along the X axis, which corresponds to ¼ of the period. In other words, the current through the capacitor is ahead of phase voltage, which is fully consistent with theory.
To calculate the current through the capacitor, it is enough to use Ohm's law: I = U / R. When the resistance of the measuring resistor is 0.1 Ohm, the voltage drop across it is 7 mV. This is the amplitude value. Then the maximum current through the capacitor will be 7 / 0.1 = 70mA.
Measuring the shape of the current through the capacitor is not some very urgent task, everything is clear and without measurements. Instead of a capacitor, there can be any load: inductor, motor winding, transistor amplifier stage and much more. It is important that this method can be used to study the current, which in some cases differs significantly in form from voltage.
Boris Aladyshkin
See also at bgv.electricianexp.com
:
